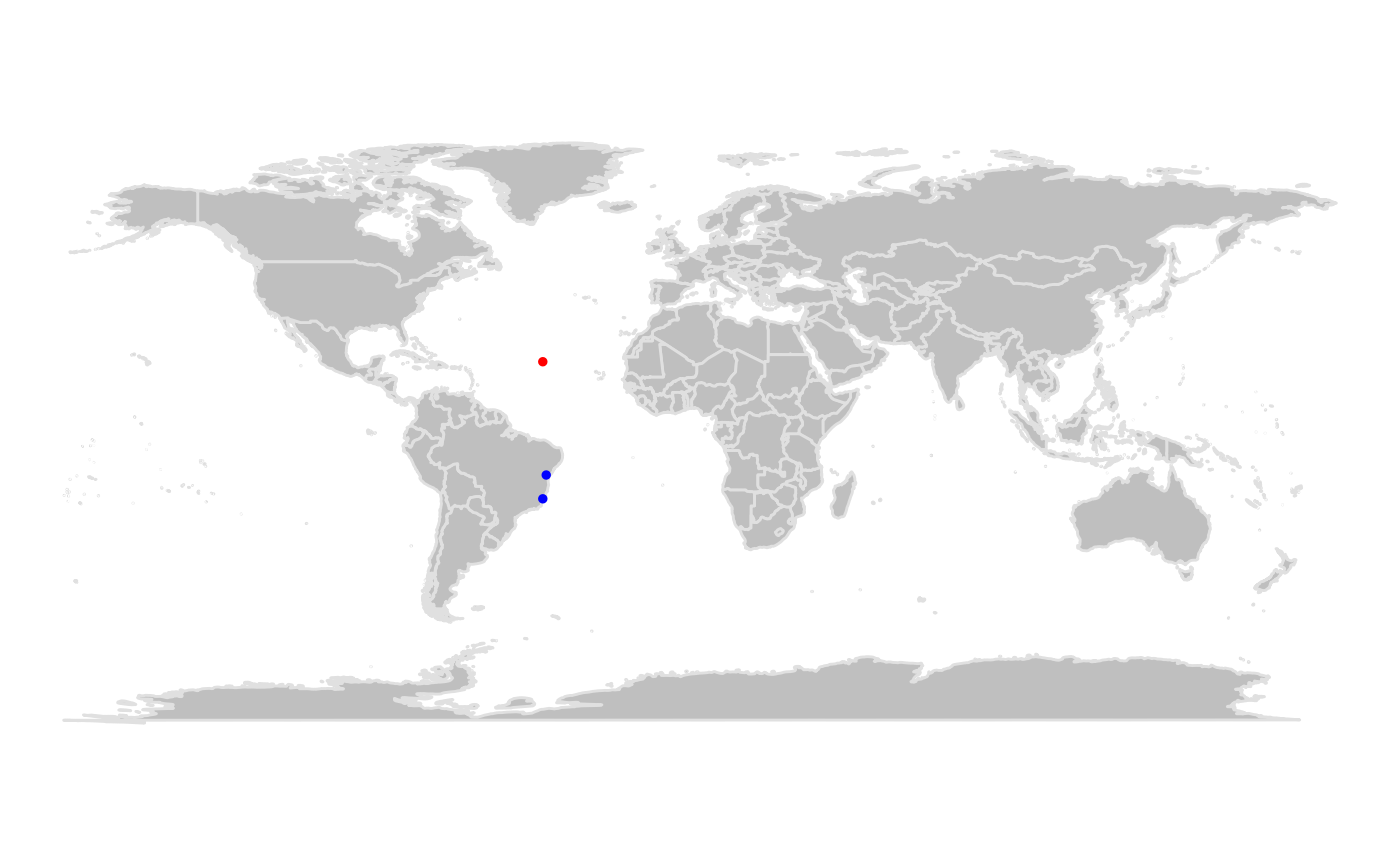
Creates a map of points using ggplot2 useful for inspecting the results of tests implemented in the bdc package.
bdc_quickmap(
  data,
  lat = "decimalLatitude",
  lon = "decimalLongitude",
  col_to_map = "red",
  size = 1
)
Arguments
- data
data.frame. Containing geographical coordinates. Coordinates must be expressed in decimal degree and in WGS84.
- lat
character string. The column name with latitude. Coordinates must be expressed in decimal degree and in WGS84. Default = "decimalLatitude".
- lon
character string. The column with longitude. Coordinates must be expressed in decimal degree and in WGS84. Default = "decimalLongitude".
- col_to_map
character string. Defining the column or color used to map. It can be a color name (e.g., "red") or the name of a column of data. Default = "blue"
- size
numeric. The size of the points.
Value
A map of points created using ggplot2.
Details
Only records with valid coordinates can be plotted. Records missing or containing invalid coordinates are removed prior creating the map.
Examples
# \donttest{
decimalLatitude <- c(19.9358, -13.016667, -19.935800)
decimalLongitude <- c(-40.6003, -39.6, -40.60030)
.coordinates_out_country <- c(FALSE, TRUE, TRUE)
x <- data.frame(decimalLatitude, decimalLongitude, .coordinates_out_country)

bdc_quickmap(
  data = x,
  lat = "decimalLatitude",
  lon = "decimalLongitude",
  col_to_map = ".coordinates_out_country",
  size = 1
)
#> Loading required package: ggplot2

# }
# }